NORTHERN VIRGINIA / SOUTHERN CALIFORNIA
Operation
How Data and Trucks Move Things
BY LAUREN E. BRIDGES

Data centers are the unseen computational machine powering much of our digital worlds, including warehouses. With every new app, device, AI model, cryptocurrency, and streaming service so too comes more demand for data centers. Data centers are central connectors in the tech digital supply chain and some of the largest consumers of digital hardware and producers of digital waste. More demand for data centers will mean more demand for extraction, manufacturing, and the production of more digital waste.
This is the brief story of two landscapes that are home to the modern digital warehouse—one that moves wares and one that processes data.
Since the early 14th century, the term “warehouse” referred to a storage site for commercial wares. Before that, Medieval empires measured their wealth by the size of their storehouses and dedicated followers traveled long distances to deposit gifts to the gods and absolve them of their sins. Today, when we think of warehouses we might imagine cavernous buildings, pallet jacks, forklifts, and robots with shelves on their backs weaving in between one another in a concert of precisely measured movements. Or maybe you think of the workers from the stories in the newspapers about being fired for taking bathroom breaks or the injuries they acquire from 10-hour shifts of bending, reaching, stretching, picking, lifting, and packing goods all while a timer counts down how long they have to complete the task.
Different from their earlier counterpart, warehouses today are superpowered by digital technologies. Wares avert dust through constant movement. Goods are scanned, cataloged, pushed, pulled, and ferried around gigantic structures on conveyor belts and intricate logistical movements that aim to maximize efficiency and minimize waste. Today’s warehouse is powered by another warehouse far across the country, one populated with computers, not people: The data center.
Northern Virginia and Southern California are home to the densest concentration of data centers and warehouses in the United States. And because these structures require ample land, power, water, and able workers, they also place uneven strain on local grid capacity, water sources, air quality, soil quality, and community well-being.
Operational Hubs of the Digital Warehouse
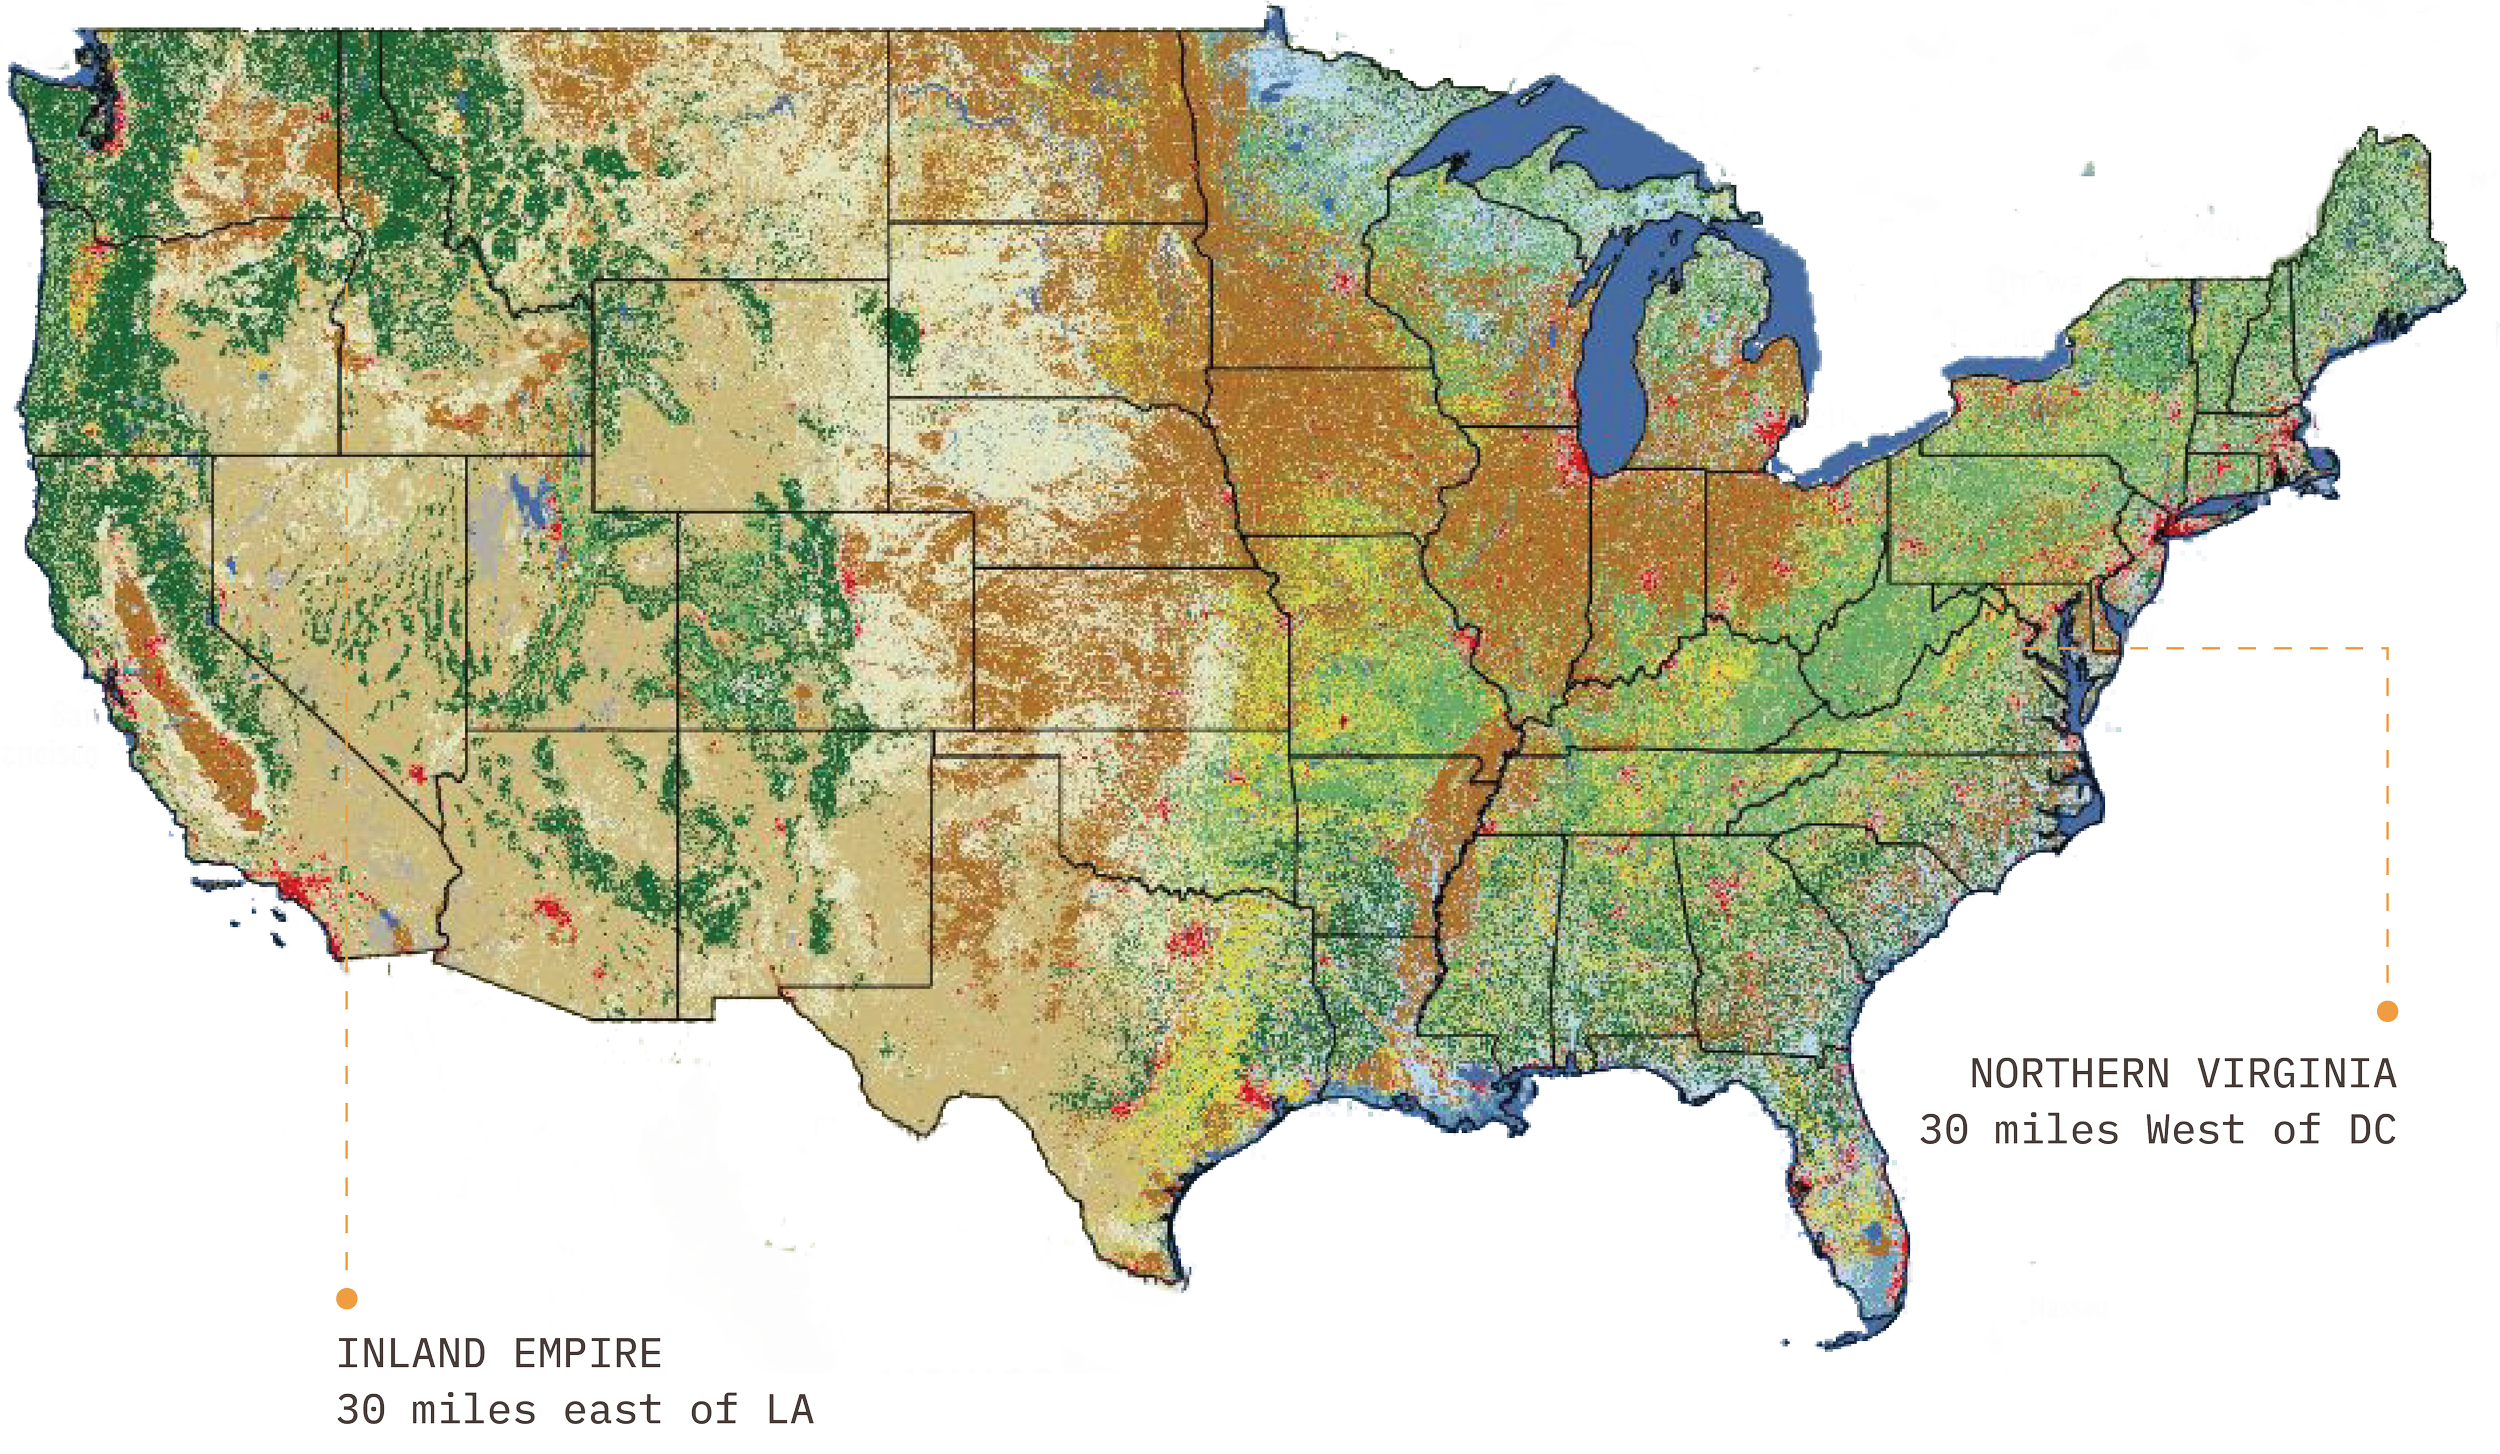
SOURCE: NLCDSee Land Changes Over Time
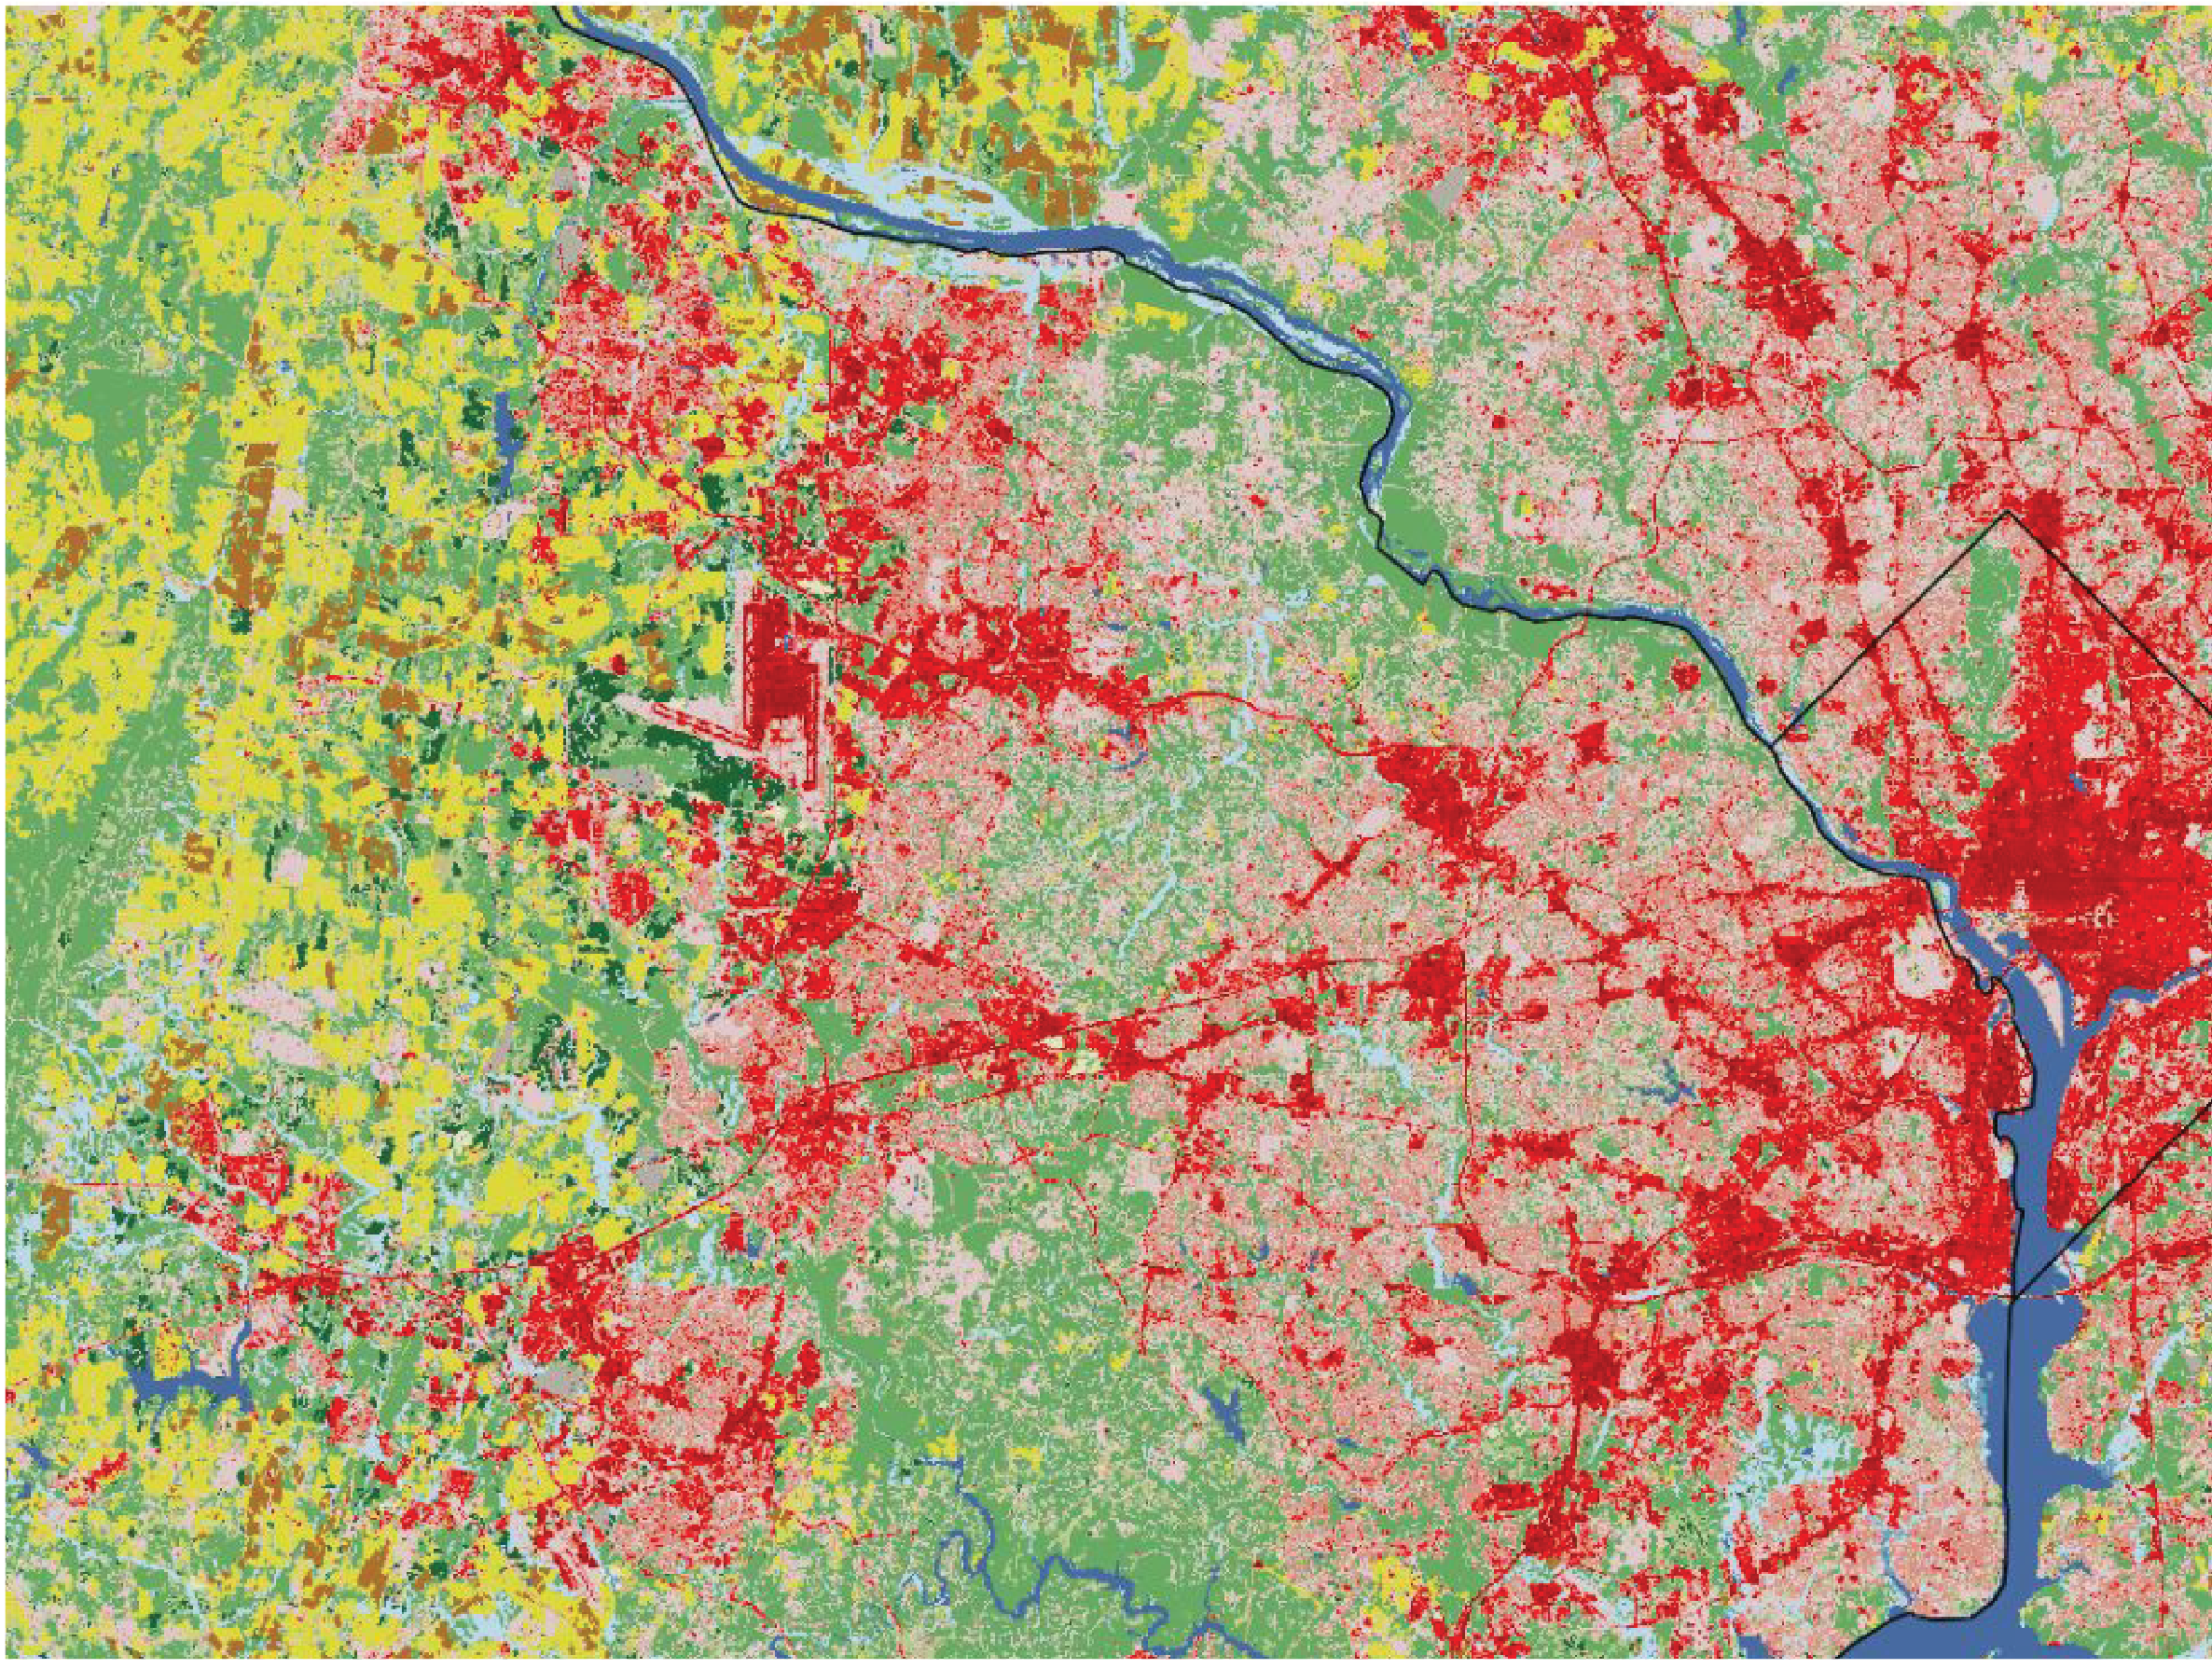

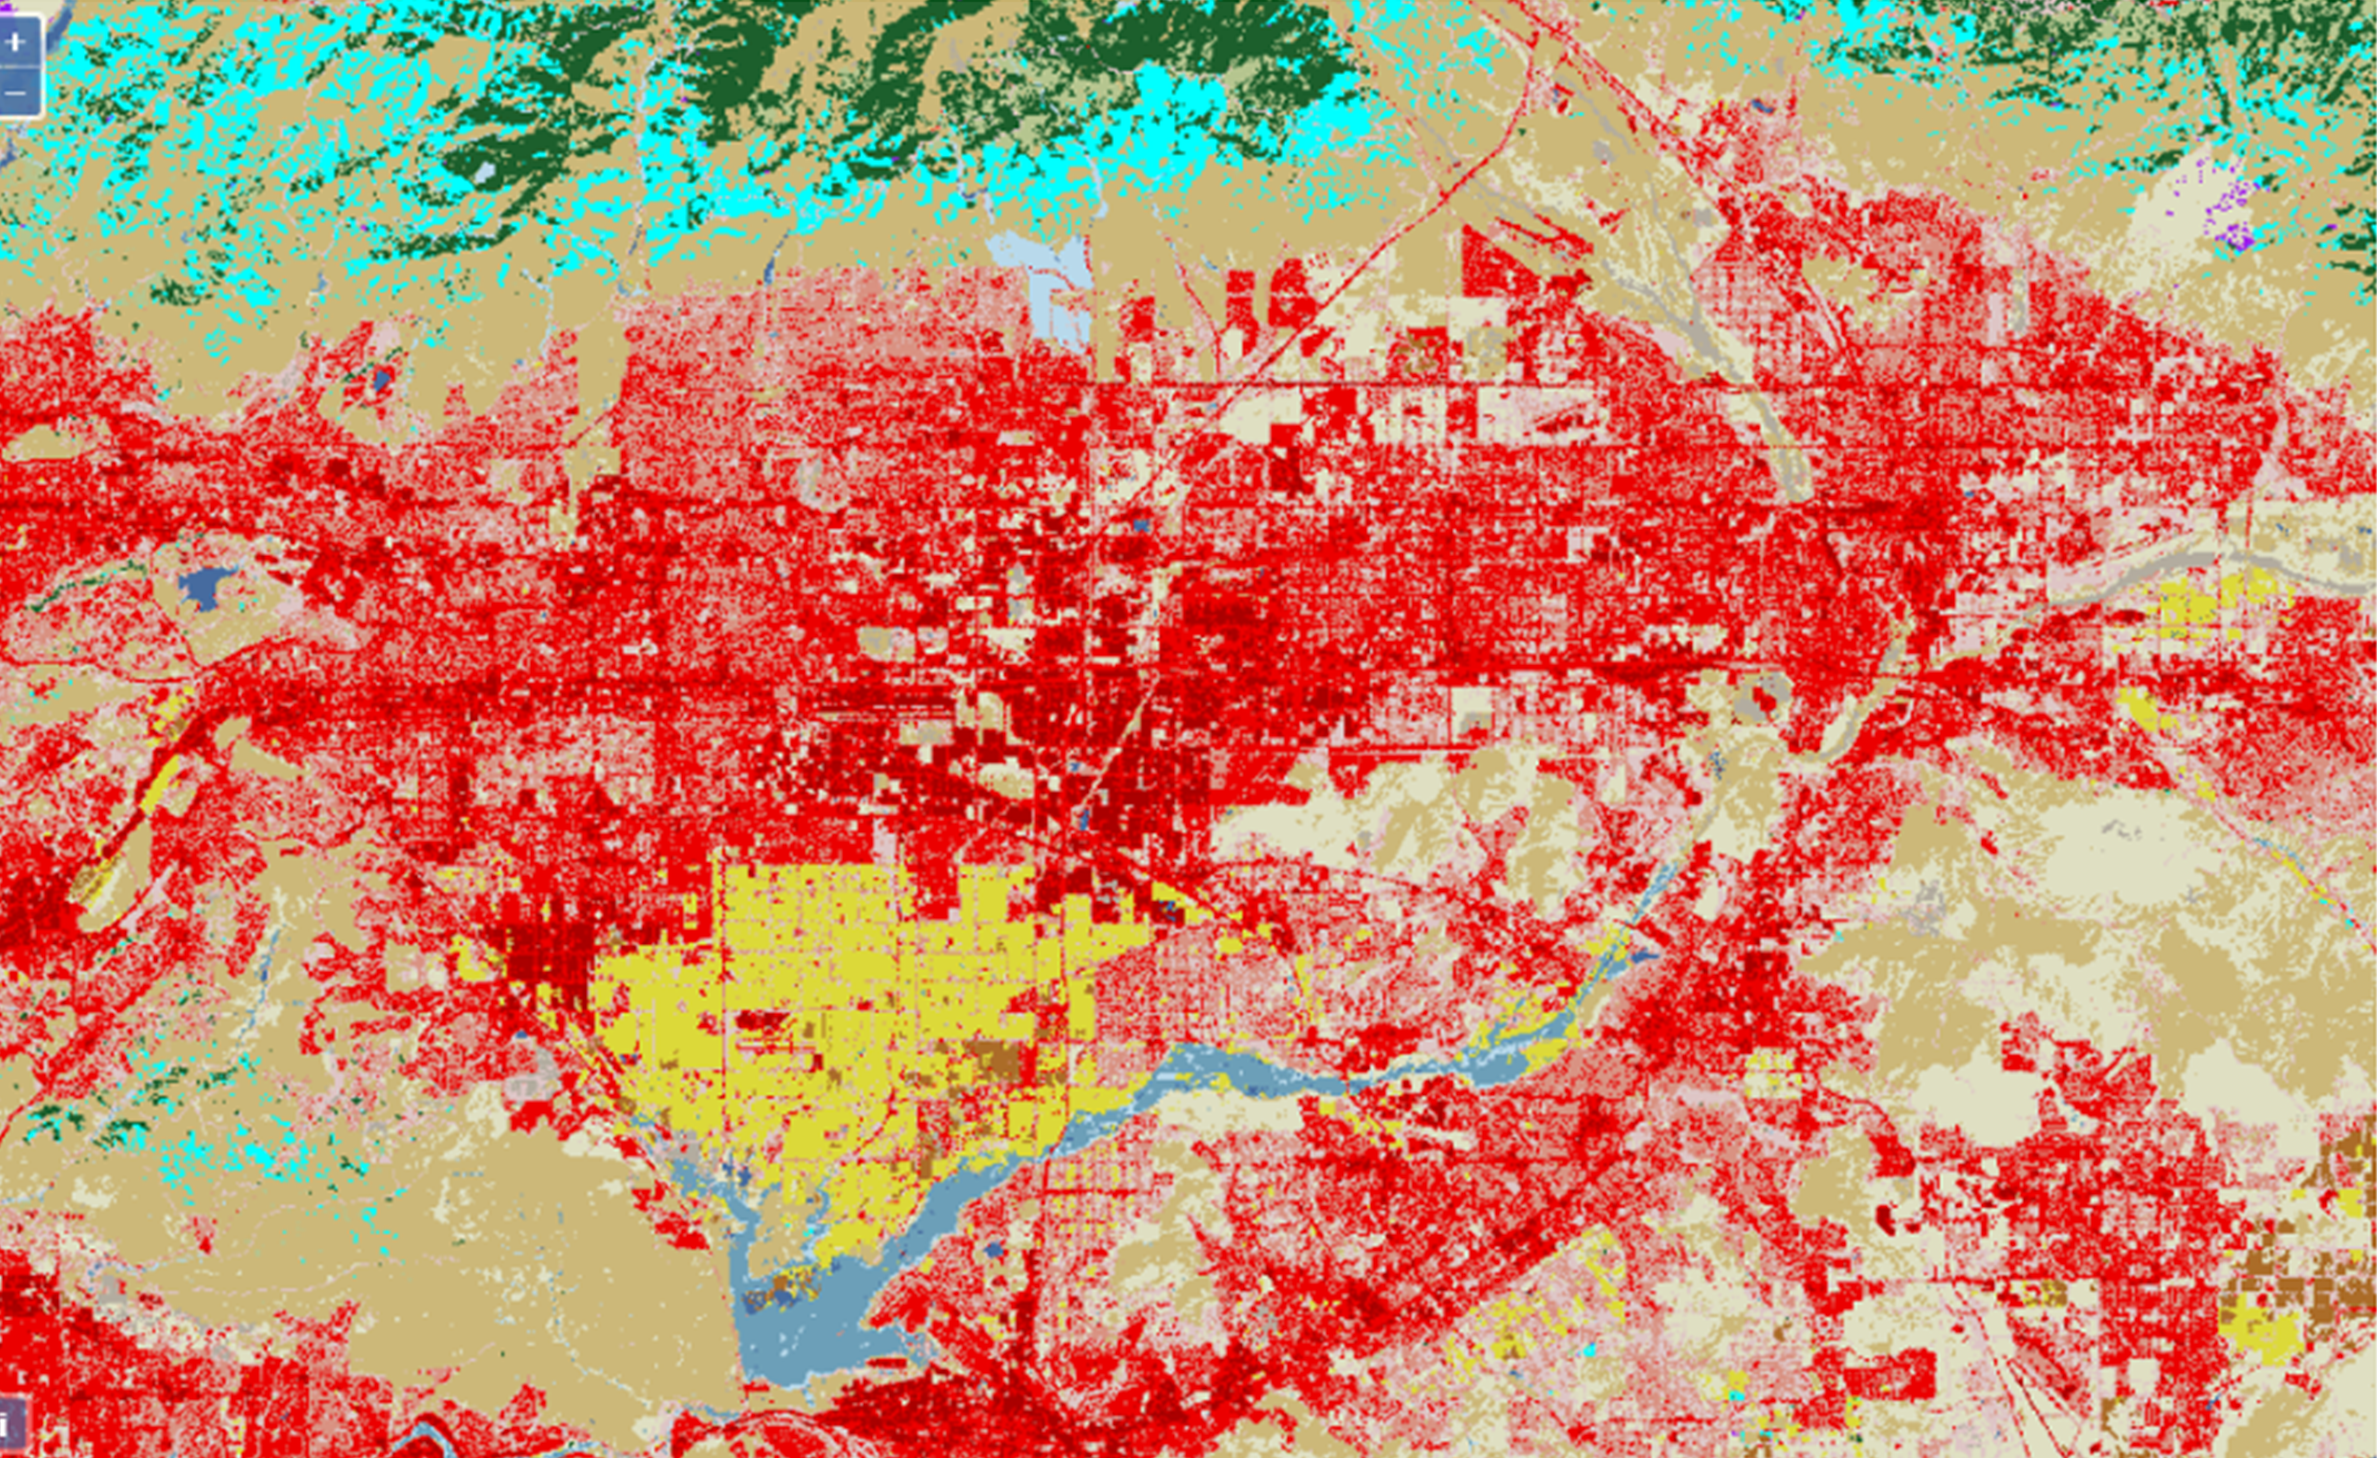
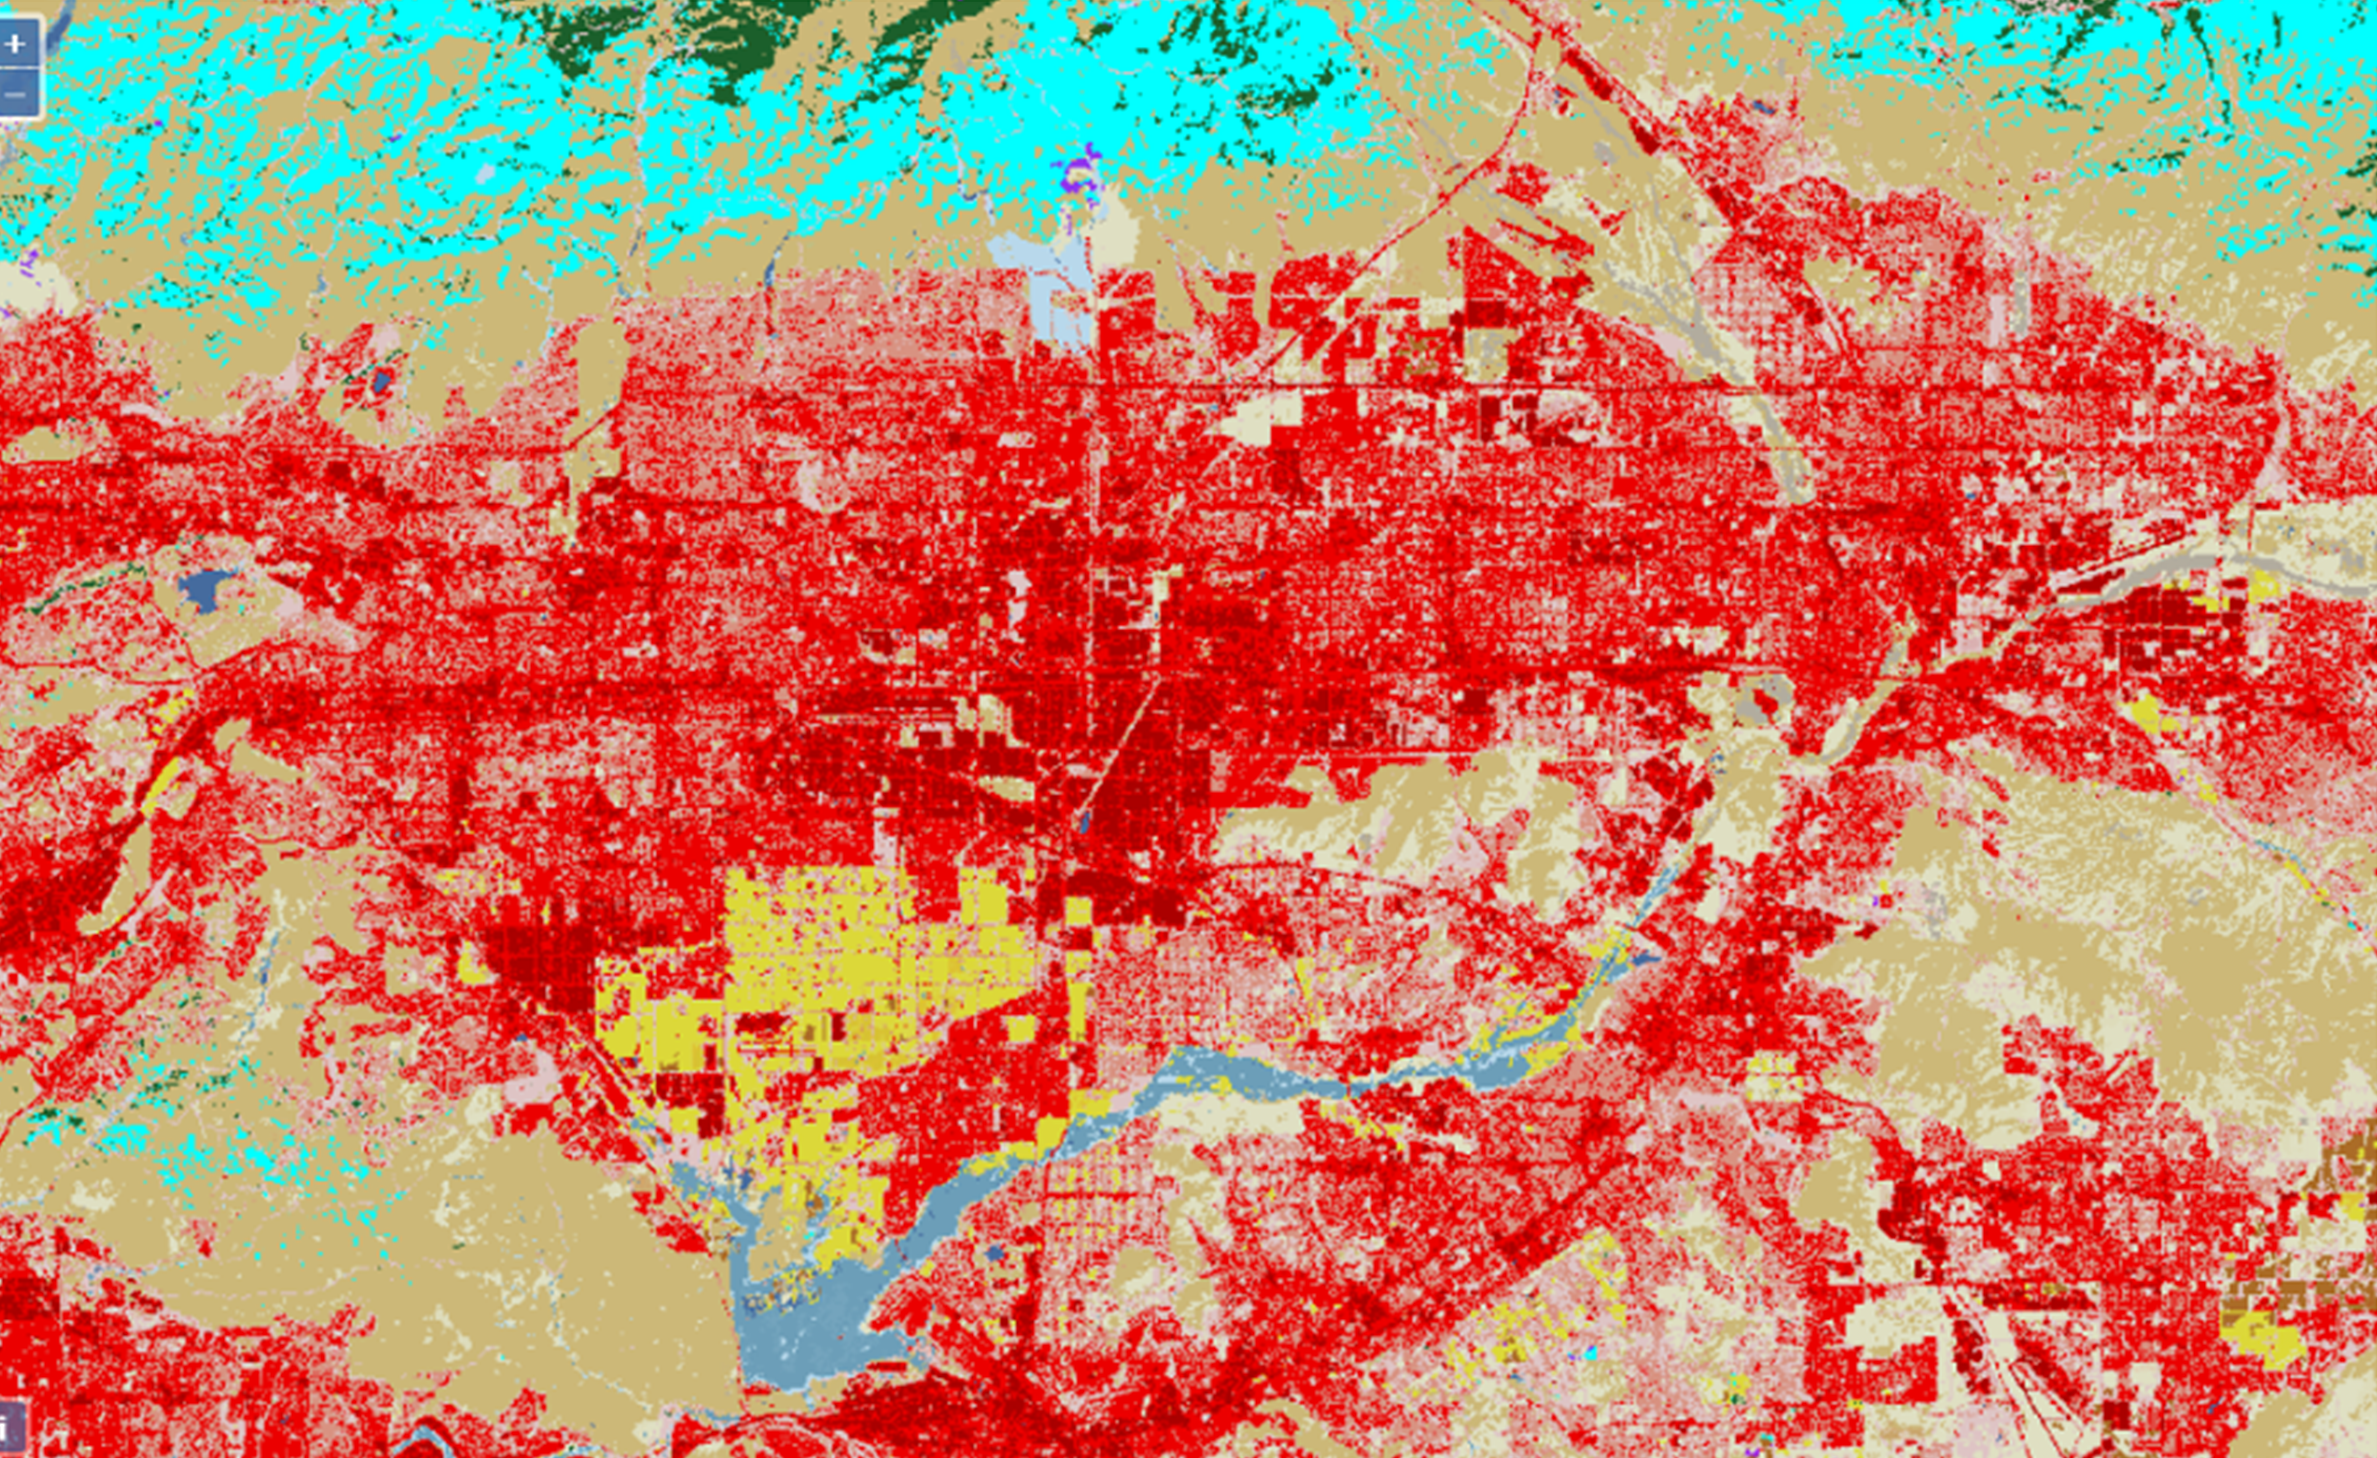
SOURCE: NLCDSEE LAND CHANGES OVER TIME KEY
WATER
Hyperscale data centers consume millions of gallons of water daily to keep computer servers cool with industrial air conditioners (Hogan, 2015; Mytton, 2021). Data centers also consume water indirectly at the site of electricity generation and in other sections of the tech supply chain. While some data center operators use reclaimed or gray water, many data center operators still largely rely on potable water often from water-stressed regions. But data centers also pose risks to the quality of local water supplies due to increased development in rural areas.
The Fairfax Water Authority, which also relies on the Occoquan, wrote a letter to Prince William County planners pleading with them to complete the water study. Yet to date, a water study in the county has not been completed.
In Northern Virginia, the Occoquan Reservoir provides drinking water to 800,000 residents across three counties. Following a spate of planned data center developments in Prince William County – including a proposed 2,000-acre data center campus (which would be the largest in the United States)—residents pressed policymakers to complete a long overdue water study. An article published in Nature Sustainability shows increased salinity levels in the Occoquan reservoir, in part due to “anthropogenic” development (including from data centers) (Bhide et al., 2021).
Aerial Image of the Occoquan Reservoir

SOURCE: PRINCE WILLIAM CONSERVATION ALLIANCELocation Map of the Occoquan Watershed

SOURCE: THE NORTHERN VIRGINIA REGIONAL COMMISSIONEARTH
Impervious surfaces from development also contribute to the growing heat island effect in urban landscapes, which leads to higher temperatures and lower rates of evapotranspiration – the process by which plants and trees absorb water through their roots and release it back into the atmosphere – further perpetuating drought conditions in already hot landscapes (Taha, 1997).
Thermal inequities have been documented in Southern California with some of the largest temperature disparities witnessed in the Inland Empire, especially in Latinx neighborhoods (Dialesandro et al., 2021).
The Warehouse Heat Island Effect

SOURCE: CALIFORNIA PROTECTION AGENCY AND GOOGLE EARTHA recent study found that on average, the poorest 10 percent of neighborhoods in California were 4°F hotter than the wealthiest 10 percent, and the difference was as high as 6–7°F in Palm Springs and the Inland Empire (Dialesandro et al., 2021).
FIRE
Burning fossil fuels still currently provides the primary energy source powering the digital warehouse. Because of this, data centers are estimated to produce 159 million metric tons of carbon annually, making them one of the world’s largest polluters (Ensmenger, 2020). Data centers are estimated to account for 2% of the world’s electricity usage, but in Northern Virginia, data centers account for 20% of all power sales and their share is growing (Dominion Energy, 2022).
While Dominion (the local utility monopoly) has been steadily decreasing its reliance on coal, the long-term impacts from over a century of burning coal has indelibly changed landscapes and local ecologies. The environmental impacts from underground coal mining – on land, water, and air quality – are well documented. But the impacts from surface coal mining, which often requires mountain top removal (MTR) to access coal seams, are just as significant. In 2021, surface coal mining made up around 29 percent of Virginia’s coal supply (Virginia Department of Energy, n.d.).
How Mountain Top Removal Works


IMAGE BY JOSEPH TART. SOURCE: HOLZMAN, 2011.Impacts from MTR mining increase the risk of cardiovascular disease, lung cancer, pulmonary disease and birth defects and are estimated to contribute to more than a thousand extra deaths each year in Appalachia (Schiffman, 2017). Many of the same communities most likely to be impacted by MTR come from economically distressed regions in Appalachia.
Metal-rich runoff below the Kayford Mountain mine.
IMAGE BY MARK SCHMERLING. SOURCE: HOLZMAN, 2011.
Downstream externalities from coal-fired power plants cause air pollution and can harm water supplies. Coal ash ponds contain cancer-causing chemicals and toxic substances, which like MTR, disproportionately harm marginalized communities.

Chesterfield Power Station Coal Ash Pond, Virginia.
SOURCE: BERTI, 2018.
90% of coal power plants in the U.S. contaminate groundwater with heavy metals and radioactive waste at levels exceeding the EPA’s health standards (Russ et al., 2022).
Contaminants include boron, lithium, molybdenum, sulfate, radium, and arsenic, exposure to which can cause cancer and impair the brains of developing children. Most of the sites are unlined (including Chesterfield, VA) and are often located close to surface water and residents are often unaware of their presence and potential threats to their drinking water (Russ et al., 2022). Despite Dominion’s plans to retire the Chesterfield power plant by 2025, many of the health and environmental impacts that accompany coal power plants continue long after they are decommissioned.
AIR
Pollution from the digital warehouse is creating geographies of toxic air. Parts of Inland Southern California, where warehouses are concentrated, are being called “diesel death zones”. Living in a logistical landscape means exposure to harmful pollutants from diesel exhaust including Nitrogen Oxides (NOx), particulate matter (PM), hydrocarbons, carbon monoxide (CO), and other hazardous air pollutants (US EPA, 2015).
NOx contributes to ground-level ozone (smog), acid raid, and forms particulate matter by reacting with other chemicals in the air. Particulate matter (PM) is a mix of solid particles and liquid droplets found in the air and is typically measured by the size of the matter (US EPA, 2016a). Inhalable mold, dust, and pollen are typically 10 micrometers (PM10) in diameter, while fine inhalable particles from combustion, organic compounds, and metals typically have a diameter of 2.5 micrometers (PM2.5) and smaller (US EPA, 2016a). Some PMs are found at the source of emissions (such as construction sites or smokestacks) and others are created through complex reactions between chemicals such as sulfur dioxide and nitrogen oxides (NOx) (Roach, 2020; US EPA, 2016a). Exposure to fine particulate matter (PM2.5) and diesel emissions (Diesel PM) poses serious health risks including respiratory diseases including asthma, decreased lung function, premature death, heart attacks, cancer, and higher birth mortality rates, among other issues (August et al., 2021; US EPA, 2016b).
Both San Bernardino and Riverside consistently report some of the worst PM2.5 and diesel PM in the United States (August et al., 2021).
Air pollution is an environmental justice issue in Southern Inland California where most residents living within close proximity to warehouses are communities of color. In 2021, The Guardian found that Amazon’s warehouses are more frequently located in communities where there are higher populations of Black and brown residents.
A 2021 study on air pollution in Inland Southern California found that participants from the lowest socioeconomic status experienced the highest exposure of PM2.5 over a 24-hour period (Do et al., 2021). Both residents of color and lower-income residents faced compounding threats under Covid-19, which had a disproportionate impact on Native American communities and Latinx communities across the US, and in California specifically (Leggat-Barr et al., 2021; Riley et al., 2021; Rodriguez-Diaz et al., 2020).
Particulate Matter in Southern California

SOURCE: CALIFORNIA PROTECTION AGENCY AND GOOGLE EARTHMost Amazon Warehouses Are In Neighborhoods of Color

SOURCE: SINGH, 2021.CALIFORNIA WAREHOUSE
Click here to see an interactive mapping of warehouse development in California.
WATCH
Data centers are full of servers that have an average life span of 2-3 years with a growing trend toward more frequent replacements. AKCP industry group estimates in 2021 there were approximately 18-million servers in data centers around the world (up from 11-million in 2006). This means that each year millions of servers enter the formal and informal trade of global e-waste. When these devices enter the informal market, they often end up in landfills, many located in the Global South, where e-waste workers are exposed to dangerous toxic metals and chemicals that have long-term health and environmental impacts.HOW MUCH STORMWATER DOES AN INCH OF RAIN PRODUCE?
When it rains, about 5% of the rain water runs of wooded areas and about 95% of the rain water runs off of a parking lot. During a one inch rainstorm:1,360
gallons of water runs off a one-acre wooded area.25,800
gallons of water runs off a one-acre parking lot.ReferencesAugust, L., Bangia, K., Laurel, P., Prasad, S., Ranjbar, K., Slocombe, A., & Wieland, W. (2021). CalEnviroScreen 4.0: California Communities Environmental Health Screening Tool (p. 207). Office of Environmental Health Hazard Assessment, California Environmental Protection Agency. https://oehha.ca.gov/media/downloads/calenviroscreen/report/calenviroscreen40reportf2021.pdfBerti, D. (2018, December 6). Chesterfield Coal Ash Ponds Under Scrutiny After Brutal Hurricane Season. RVA Mag. https://rvamag.com/news/community/chesterfield-coal-ash-ponds-under-scrutiny-after-brutal-hurricane-season.htmlBhide, S. V., Grant, S. B., Parker, E. A., Rippy, M. A., Godrej, A. N., Kaushal, S., Prelewicz, G., Saji, N., Curtis, S., Vikesland, P., Maile-Moskowitz, A., Edwards, M., Lopez, K. G., Birkland, T. A., & Schenk, T. (2021). Addressing the contribution of indirect potable reuse to inland freshwater salinization. Nature Sustainability, 4(8), Article 8. https://doi.org/10.1038/s41893-021-00713-7Dialesandro, J., Brazil, N., Wheeler, S., & Abunnasr, Y. (2021). Dimensions of Thermal Inequity: Neighborhood Social Demographics and Urban Heat in the Southwestern U.S. International Journal of Environmental Research and Public Health, 18(3), Article 3. https://doi.org/10.3390/ijerph18030941Do, K., Yu, H., Velasquez, J., Grell-Brisk, M., Smith, H., & Ivey, C. E. (2021). A data-driven approach for characterizing community scale air pollution exposure disparities in inland Southern California. Journal of Aerosol Science, 152, 105704. https://doi.org/10.1016/j.jaerosci.2020.105704Dominion Energy. (2022). 2021 Sustainability & Corporate Responsibility Report (pp. 1–105). Ensmenger, N. (2021). The Cloud is a Factory. In T. S. Mullaney, B. Peters, M. Hicks, & K. Philip (Eds.), Your computer is on fire (pp. 1–21). The MIT Press.Hogan, M. (2015). Data flows and water woes: The Utah Data Center. Big Data & Society, 2(2), 205395171559242. https://doi.org/10.1177/2053951715592429Holzman, D. C. (2011). Mountaintop Removal Mining: Digging Into Community Health Concerns. Environmental Health Perspectives. https://doi.org/10.1289/ehp.119-a476Leggat-Barr, K., Uchikoshi, F., & Goldman, N. (2021). COVID-19 risk factors and mortality among Native Americans. Demographic Research, 45, 1185–1218. https://doi.org/10.4054/DemRes.2021.45.39Mytton, D. (2021). Data centre water consumption. Npj Clean Water, 4(1), Article 1. https://doi.org/10.1038/s41545-021-00101-wRiley, A. R., Chen, Y.-H., Matthay, E. C., Glymour, M. M., Torres, J. M., Fernandez, A., & Bibbins-Domingo, K. (2021). Excess mortality among Latino people in California during the COVID-19 pandemic. SSM - Population Health, 15, 100860. https://doi.org/10.1016/j.ssmph.2021.100860Roach, C. (2020, December 6). Air Pollution in the Inland Empire. ArcGIS StoryMaps. https://storymaps.arcgis.com/stories/fe2811197ce1427db17a808593f1526eRodriguez-Diaz, C. E., Guilamo-Ramos, V., Mena, L., Hall, E., Honermann, B., Crowley, J. S., Baral, S., Prado, G. J., Marzan-Rodriguez, M., Beyrer, C., Sullivan, P. S., & Millett, G. A. (2020). Risk for COVID-19 infection and death among Latinos in the United States: Examining heterogeneity in transmission dynamics. Annals of Epidemiology, 52, 46-53.e2. https://doi.org/10.1016/j.annepidem.2020.07.007Russ, A., Kelderman, K., Evans, L., & Weinberg, C. (2022). Poisonous Coverup: The Widespread Failure of the Power Industry to Clean Up Coal Ash Dumps (pp. 1–212). Environmental Integrity Project and Earthjustice. https://earthjustice.org/sites/default/files/press/2022/coal-ash-report_poisonous-coverup_earthjustice.pdfSchiffman, R. (2017, November 21). A Troubling Look at the Human Toll of Mountaintop Removal Mining. Yale E360. https://e360.yale.edu/features/a-troubling-look-at-the-human-toll-of-mountaintop-removal-miningSingh, M. (2021, December 9). ‘Warehouses in their backyards’: When Amazon expands, these communities pay the price. The Guardian. https://www.theguardian.com/us-news/2021/dec/09/when-amazon-expands-these-communities-pay-the-priceTaha, H. (1997). Urban climates and heat islands: Albedo, evapotranspiration, and anthropogenic heat. Energy and Buildings, 25(2), 99–103. https://doi.org/10.1016/S0378-7788(96)00999-1US EPA, O. (2015, April 13). About Diesel Fuels [Overviews and Factsheets]. https://www.epa.gov/diesel-fuel-standards/about-diesel-fuelsUS EPA, O. (2016a, April 19). Particulate Matter (PM) Basics [Overviews and Factsheets]. https://www.epa.gov/pm-pollution/particulate-matter-pm-basicsUS EPA, O. (2016b, April 26). Health and Environmental Effects of Particulate Matter (PM) [Overviews and Factsheets]. https://www.epa.gov/pm-pollution/health-and-environmental-effects-particulate-matter-pmVirginia Department of Energy. (n.d.). Classification of Coals by Rank. Virginia Energy. https://doi.org/10.1520/D0388-12